HandyDash - Web Monitor
About this article
In this article I discuss HandyDash, a tool that I’ve created for application and systems monitoring. I share my reasons for developing the tool, and discuss various facets of operational monitoring.
HandyDash v1 is free, cross platform, and available for download via GitHub.
Why HandyDash?
As a software engineer I'm naturally interested in the health, performance, and security of my applications. I'm also cognizant of the third party services and APIs underpinning platforms that I build, and how these can affect platform reliability. Traditionally these concerns are left to an operations team to monitor and act upon, and more recently, site reliability engineers.
Application and systems monitoring is essential for any technology team. It expedites the identification of issues, enabling remediation steps to be initiated sooner. Finding the right tooling, and implementing an appropriate level of monitoring, can however be challenging. For example:
- Several monitoring tools can be complex to configure and operate.
- Few tools correlate failures across interconnected systems and system layers.
- Few tools enable the visual mapping of the architectures that they monitor.
- Knowing what to monitor, and to what extent, often requires a heuristic approach.
While the advent of cloud hosting may alleviate some monitoring concerns, any systems hosted outside the cloud, or hosted with a different vendor, may fall outside the scope of a single cloud monitoring solution. Aggregated monitoring across Azure and AWS can be achieved through tools like Amazon CloudWatch, however there is moderate technical overhead to achieve this. Cloud monitoring tools are also heavily geared towards metric presentation, with limited illustration of application and system relationships, and upstream/downstream failures.
There is no doubt that advanced telemetry can offer valuable insights into system performance, security, and stability. But in its most basic form, application and systems monitoring can be achieved by observing a handful of key metrics. Presenting these metrics in a concise and intuitive fashion, allows teams to quickly discern platform health, without requiring the interpretation of multiple disparate charts.
Features
Given the considerations discussed above, I set about developing HandyDash with some specific features in mind. I wanted a monitoring tool that:
- Doesn't require the installation of agents on target systems.
- Is simple to configure, without requiring programming or scripting knowledge.
- Can visually represent the platforms that my team is monitoring.
- Distinguishes the criticality of different events.
- Distinguishes between application failures and lower level connectivity failures.
- Articulates failures in a way that is actionable for my operations team.
- Links the systems underpinning composite platforms, and propagates failures to upstream nodes.
Given that it’s a stand alone executable, HandyDash provides a convenient external viewpoint for the observation of applications and systems. As an independent source of telemetry, it can be used to reconcile the state of cloud hosted platforms, and help identify grey failures.
Another feature of HandyDash is that it targets the application layer through HTTP checks, but automatically falls back to transport and network layer checks, when each higher level check fails. This means that the tool is able to differentiate between failures that are application related or hosting and system related. This multilayered approach to monitoring enables greater context within error messages, and shortens the time spent assessing the relevance of particular failures.
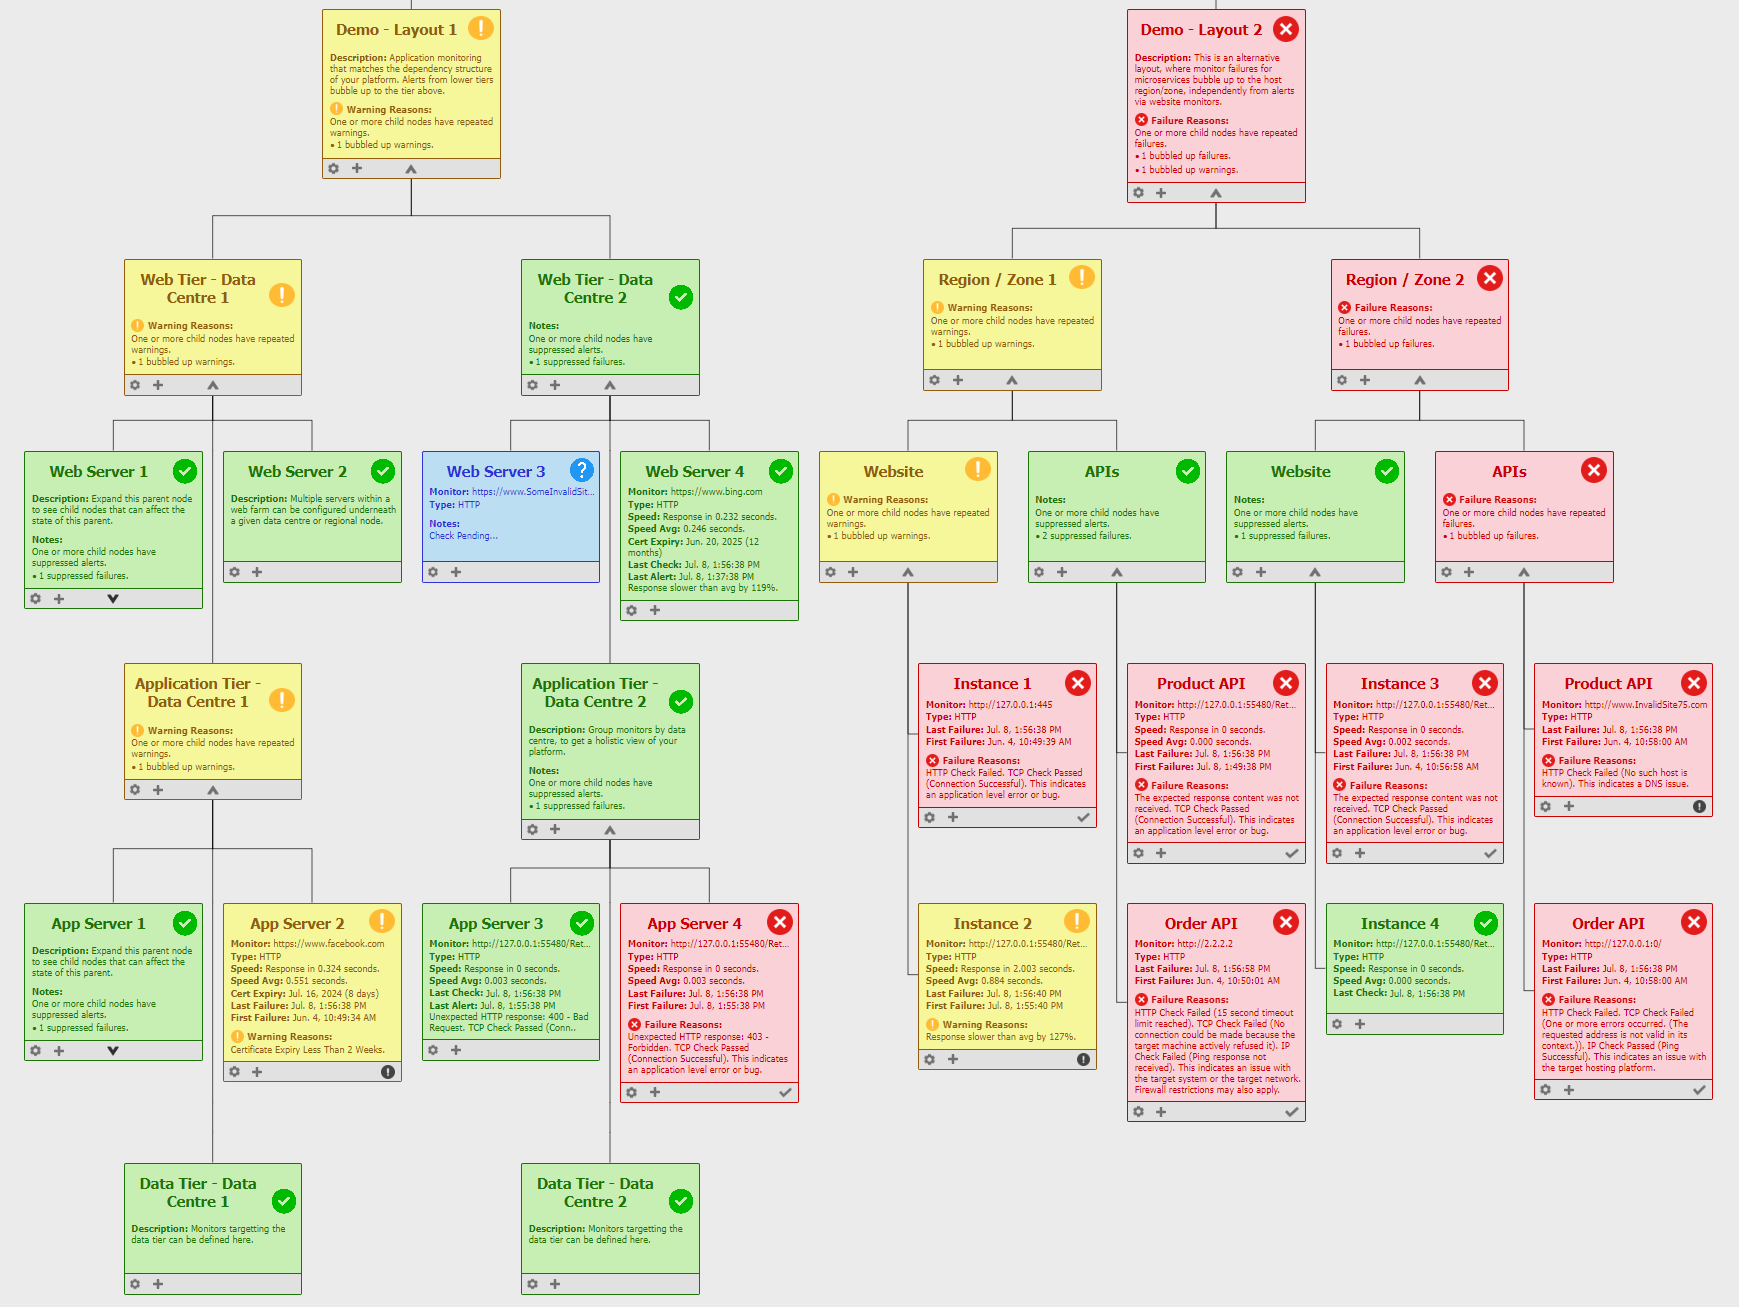
The most evident feature of HandyDash however, is the tree based UI. Linking individual monitors within a tree structure, enables repeated warnings and failures to be propagated to parent and ancestor nodes. This is particularly useful for platforms with many endpoints, where lower leaf monitor nodes may be minimized and hidden from view.
Further features are discussed on GitHub, such as certificate chain validation, and response validation.
Suitability
One question technology teams may have, is how would HandyDash fit into our current monitoring practices? This is certainly an important consideration for larger technology teams that may already utilise enterprise level products.
For smaller organisations with zero to little active monitoring, HandyDash is an ideal starting point for web based monitoring. For medium and large organisations already utilising monitoring solutions, HandyDash can compliment existing products and bespoke tooling.
Regardless of organisation size, HandyDash has been designed for ease of use, and high visibility. The UI has been built with wall mounted screens in mind, but is equally as convenient on individual workstations.
Limitations
Given that it’s a nascent product, it’s worth noting the current limitations of HandyDash. For instance, notifications are not yet available for monitor failures.
Also, while the UI for HandyDash is browser based, and could be made available via a local network URL, it is not currently built with parallel use in mind. Therefore if one user collapses or expands particular tree nodes, this will be visible to other users within their personal browsers, after the next UI refresh (along with other configuration changes).
Other monitoring tools that are agent based will typically expose metrics such as CPU and memory utilisation, via the Simple Network Management Protocol (SNMP) or other proprietary APIs. As HandyDash is agent free, all metrics are obtained through the polling of accessible endpoints and interfaces. This means that internal metrics pertaining to the system resources on target hosts, are not available via HandyDash.
Looking Ahead
HandyDash is currently a personal project, however I do plan on adding further features as time permits. Please feel free to get in touch via email, or via GitHub regarding feature requests and / or bugs. Thanks.